


Andy Ellis explains how data generated from a KNX system can be used in graphical form to provide greater insight into a system's performance to benefit installers and clients. The article also contains useful practical examples.
KNX
is such a versatile, robust system that, in my view, it should be specified as
an integral part of a building's infrastructure throughout its life. It is also
in a prime position to exploit the extensive amounts of data that can be easily
extracted from any installation, especially given that every time an activity
is started, the message (i.e. telegram) will travel throughout the entire KNX
bus. If this telegram is not recorded, it is lost forever, so this article
looks at how to record the data in a graphical format in order to add value to
an installation.

The
benefit of using KNX for data management
The
benefit of KNX as the data management tool is that it enables analysis of
multiple layers of data without incurring the cost of an additional monitoring
system. In commercial environments, KNX data can be reviewed as part of big
data. Research shows that connected devices in commercial buildings are
expected to grow to just under 3 billion by 2025, and that sensors and devices
that track occupancy and movement will experience the highest rates of growth.
Buildings that enable smart technologies can reduce costs on average by 15%
creating an environment that reduces energy waste, increases comfort and
stimulates employee productivity.
Retrieving
KNX data and presenting it in a graphical format offers a number of advantages.
These include the ability to:
- Determine root causes of failure in real time.
- Notice trends in equipment behaviour in order to facilitate predictive maintenance.
- Realise cost savings by improving system efficiency.
- Improve occupancy comfort and health.
- Monitor a building's status.
- Provide the end-user with visible evidence of what is happening in their property.
- Store a timeline of activity.
Examples
of KNX graphing
A)
Bathroom temperature analysis
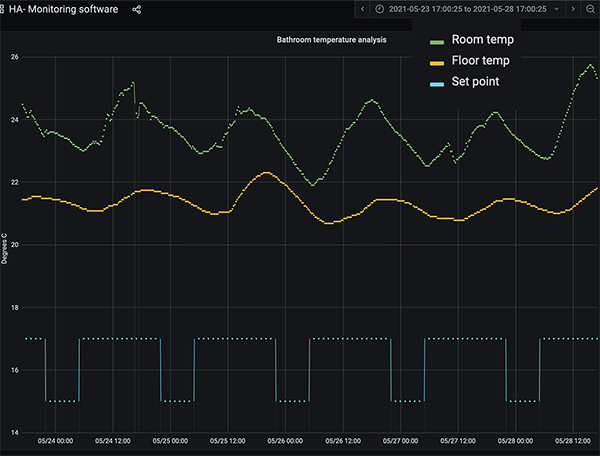
At first it appears that over a five-day period, the bathroom
heating has been reacting to the set point and night-time set back. In actual
fact, upon closer inspection, we see that the set point is low (17oC
during the day and 15oC during the night), the room temperatures are
whole-room/house variations and there is no heating on.
B) Living room heating demand
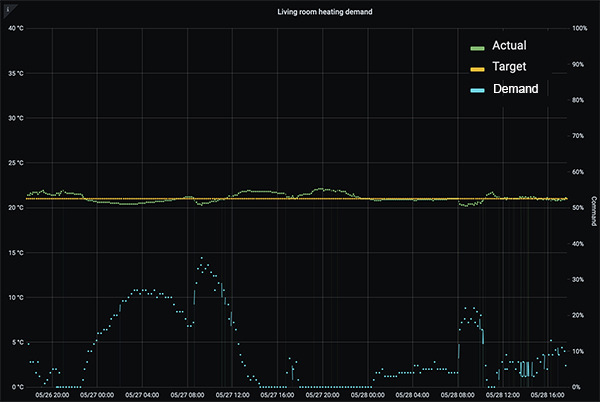
Here we can see a temperature set point of 21oC and how a 'fine-tuned' KNX heating control
system is able to maintain +/-0.5oC using proportional demand. See,
when the room temperature dips, the immediate reaction of the demand. Due to
the small temperature variations the demand is ever only required at 15% of
duty.
C)
Building versus outside temperature
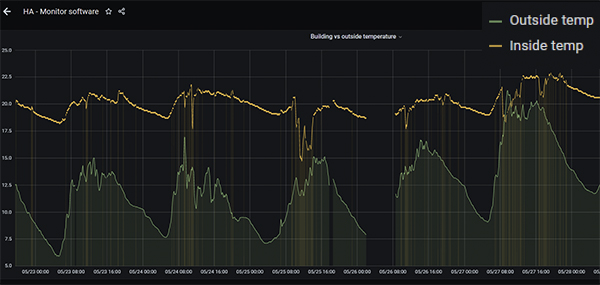
The first thing to notice here is that there is an interruption
in the broadband connection. Indeed, the software can be set up to provide
e-mail alerts for any event, be it a power or broadband failure or when there
is a system error such as a light fitment failure or over heat temperature. The
graph is clearly showing increased correlation between inside and external
temperature over time as the outside temperature increases.
The
practicalities of collecting and recording data
Firstly
you will need to consider the security implications of recoding data. KNX is an
open standard (EN 500090, ISO/IEC 14543) for commercial and domestic building
automation and is backed up by the following security standards:
- KNX Data secure (EN 500090–3-4) - which secures telegrams on twisted pair (TP) cable and over RF.
- KNX IP secure (ISO 22510) - which secures telegrams tunnelled via IP.
So,
whether you are collecting data locally ‘in house’ or remotely in the cloud, as
long as the systems are correctly set up, you can be sure that your data
security is implemented to the correct level.
If
you are going to use the data to produce meaningful graphs then you will need
to set up local or cloud storage, connect to the KNX data bus and then read the
data and translate it into a graphical format. In
addition to having access to a storage facility, you will need software to
manage the server and front-end software in order to view the collected data in
a graphical format.
These kind of software tools are not currently readily available
though, so my company's solution – given that monitoring forms an integral part
of our service and maintenance contracts – was to develop its own monitoring
software called MORE. This is currently available for use by selected partners,
and there are plans to make it more widely available in future.
Conclusion
As shown, monitoring a system's operation through data
collection and analysis already offers significant benefits to the installer as
well as the home owner or building manager. These include fault finding,
predictive maintenance, evidence of operation, improved efficiency and user
comfort, and more.
Over the longer term, as KNX IoT rolls out, the use of big data will become a standard part of a smart living strategy, offering the ability to mine the rich data generated by KNX-based systems for even greater benefit to all.
Andy Ellis is the founder and
managing director of Household Automation Ltd, and its sister company Knxion
Ltd, providers of building automation consultancy, design, installation and
aftercare services to clients who are involved in building residential and
commercial properties.